|
|
End-to-End IoT |
|
|
End-to-End IoT |
Our client for this project is investigating the use of Pulse Wave Transit Time (PWTT) as a non-invasive proxy for cardiac status. PWTT is a measure of the time from the R-peak of an ECG signal to the minimum of the PPG signal (maximum absorption) that follows somewhere on the body (e.g. index finger). We developed software and additional hardware for the first generation Maxim HSP platform to accurately estimate PWTT in real-time, display the measurements on an LED display and send results to a mobile app connected over BLE. To facilitate more in-depth post processing and signal analysis, raw signal data for each session is stored in on-board flash and downloaded later over USB or BLE.
The key to measuring PWTT well is absolute timing accuracy. There are many time dependent components at play in this system but most notably, the ECG and PPG acquisition devices run in different clock domains, each subject to drift with temperature over the course of operation. To compensate, we track both signals independently and carefully estimate the time sequence of sample arrivals for both signals relative to the reference clock of the micro-controller. The resulting timing error is less than 3ms worst case.
We also pay considerable attention to the quality of the acquired signals, careful not to filter out or distort physiologic features while simultaneously incorporating novel averaging techniques to improve signal/noise.
Every component of the system was implemented twice: (1) in python with the obvious benefits of an interpreted high-level language, desktop visualization tools, etc. and (2) in C/C++ running on the MAX32620 embedded micro-controller. Both implementations can run in real-time with live signal inputs.
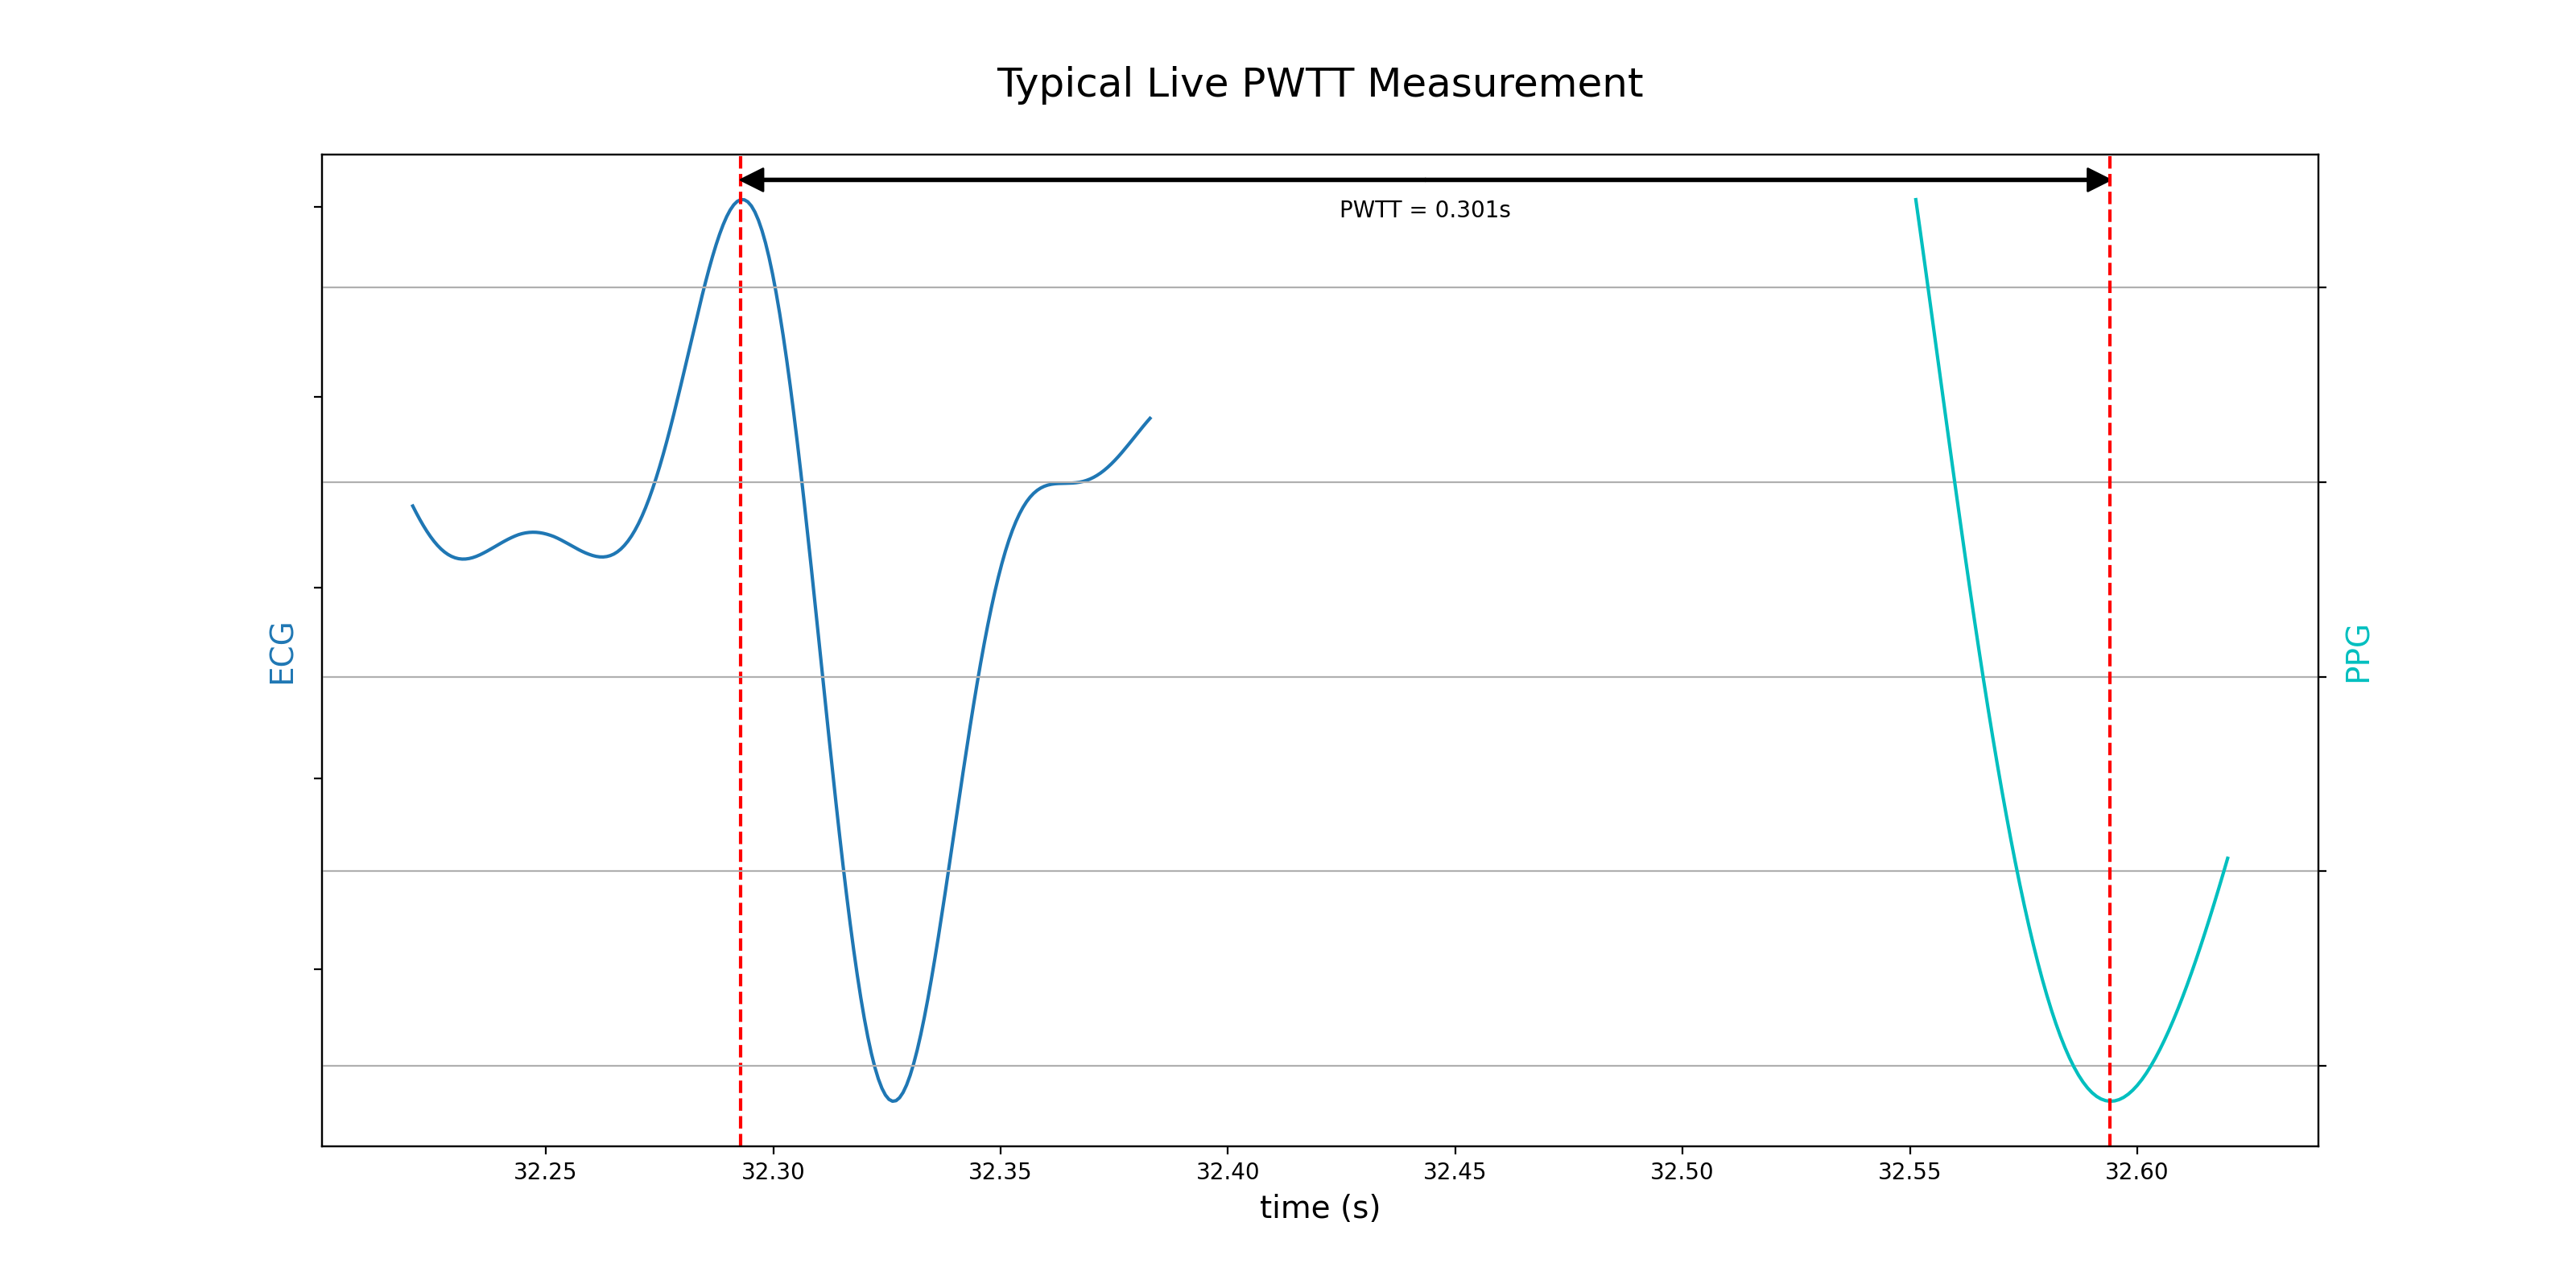
The end result is a very clean and accurate measure of live subject's PWTT:
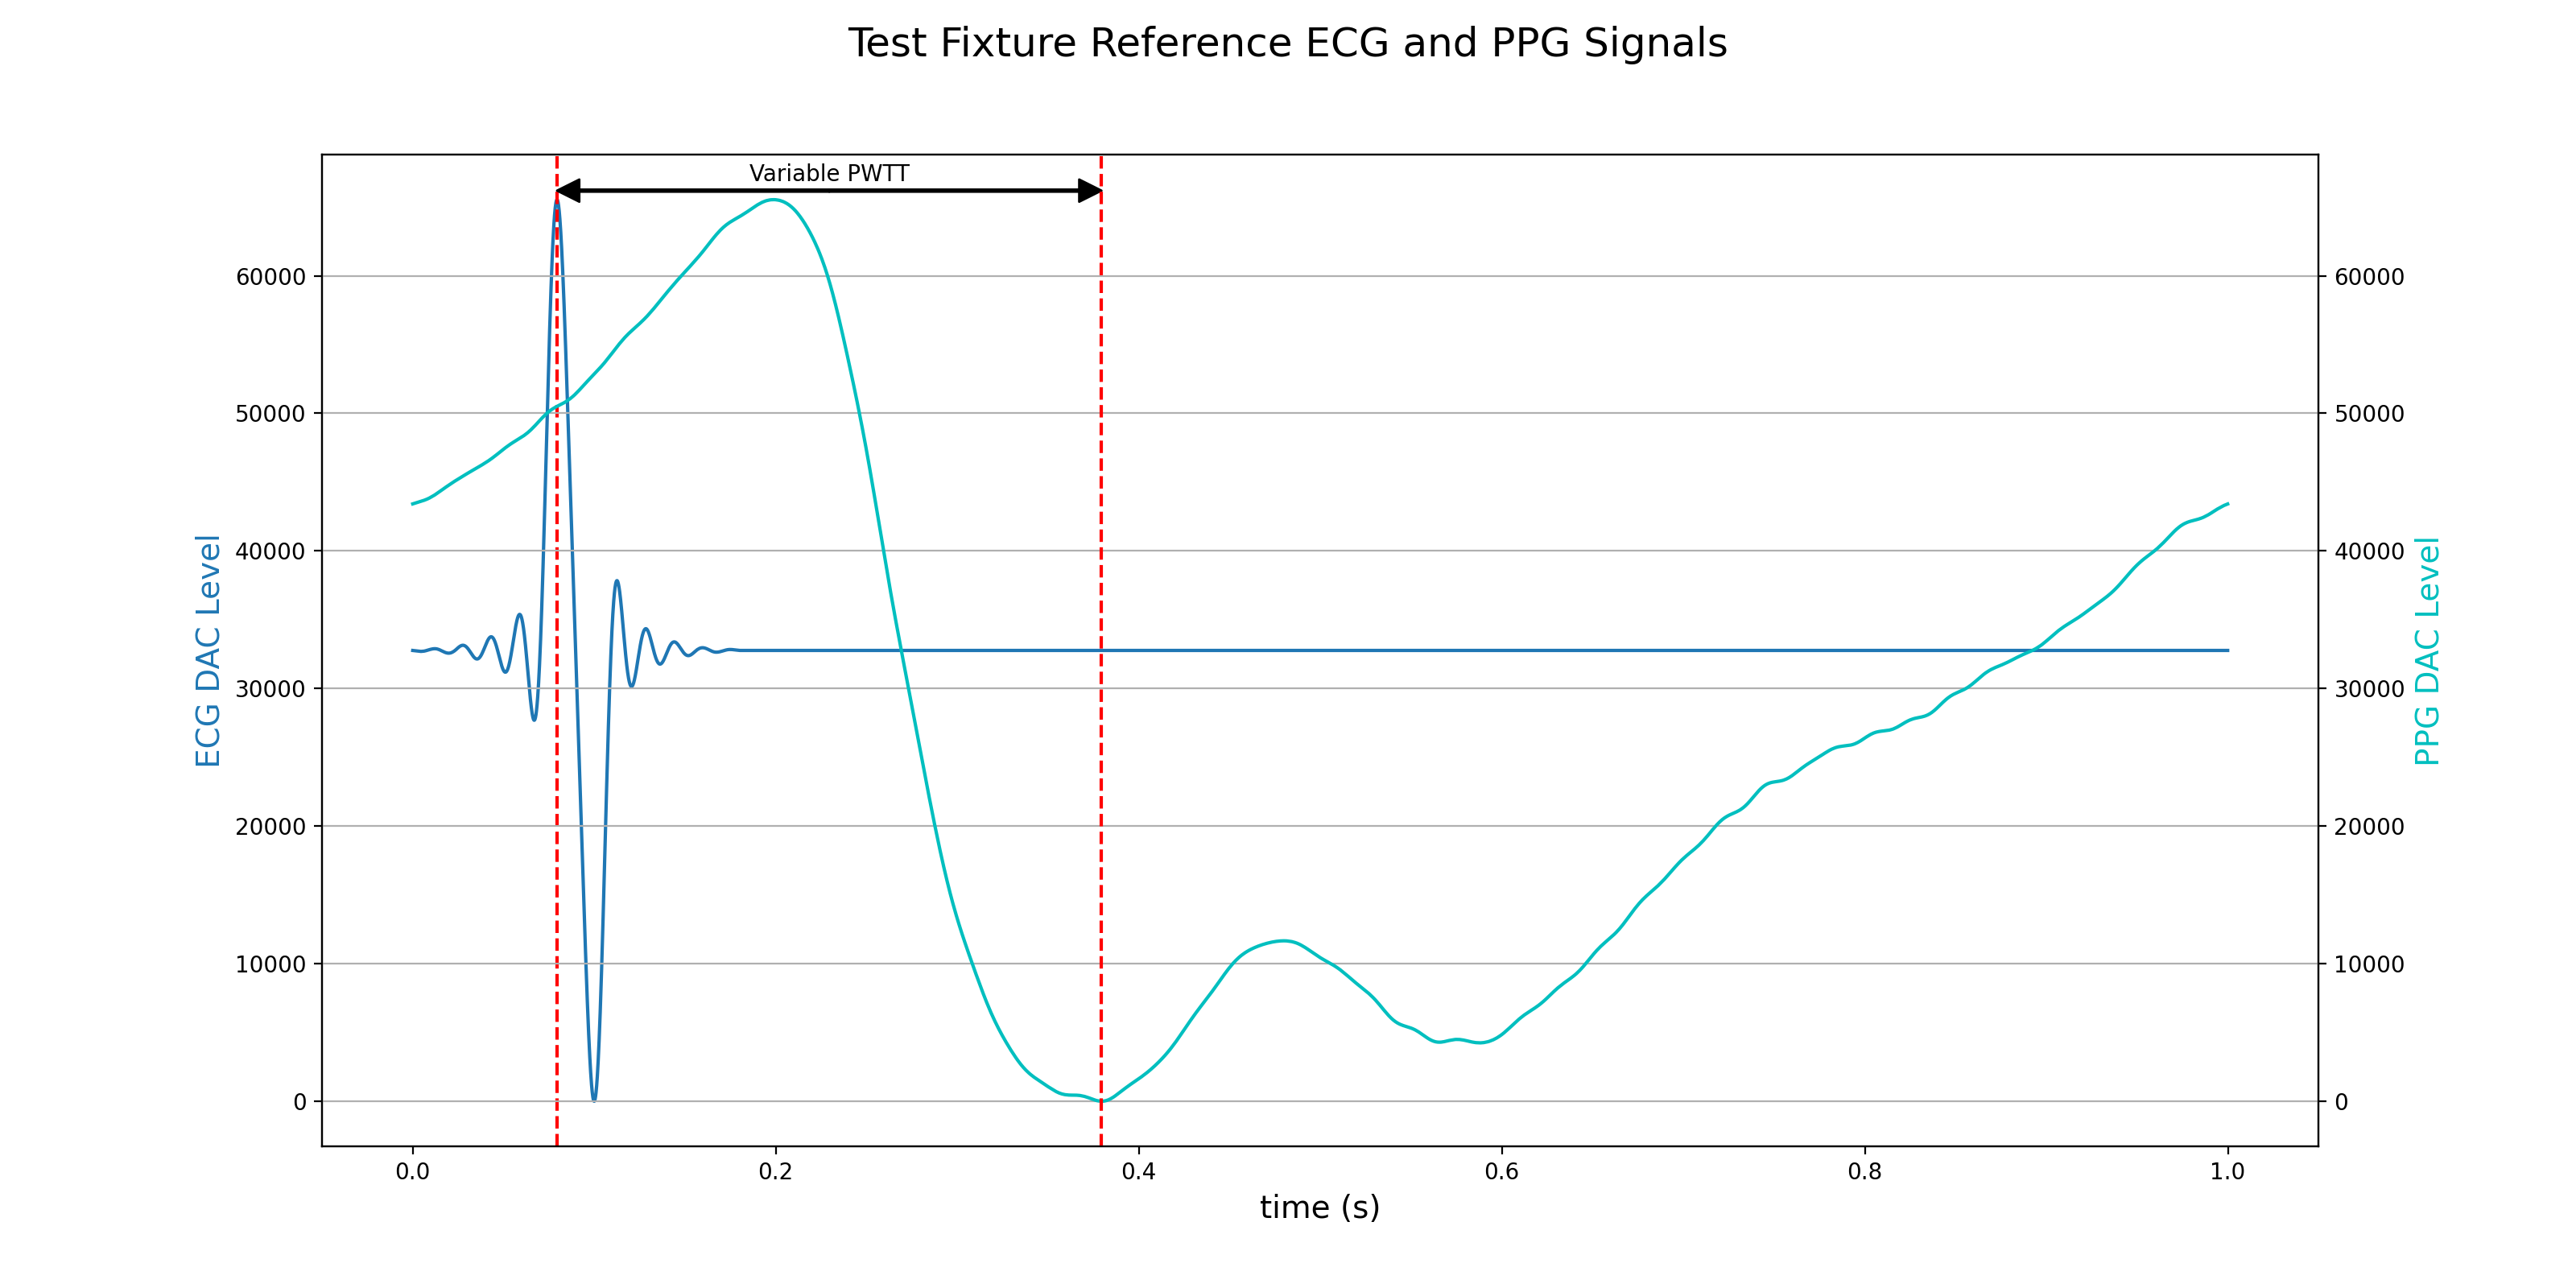
To verify system performance we designed and implemented a custom test fixture to generate reference ECG and PPG signals. The reference signals are fully synchronous (generated via stereo DACs with a common clock) so the relative timing of ECG and PPG will be constant. The fixture's ECG output circuit drives the differential ECG input of the device under test directly and the PPG output circuit drives a single LED which is then coupled to the PPG input photodiode. In a typical configuration the reference signals repeat once per second to simluate a heart rate of 60 bpm; the PPG signal buffer is easily rotated to vary the effective PWTT. The received ECG signal is very clean. The received PPG signal is noisy (signal/noise =~ 20dB) but the key parameter of constant relative timing is achieved.
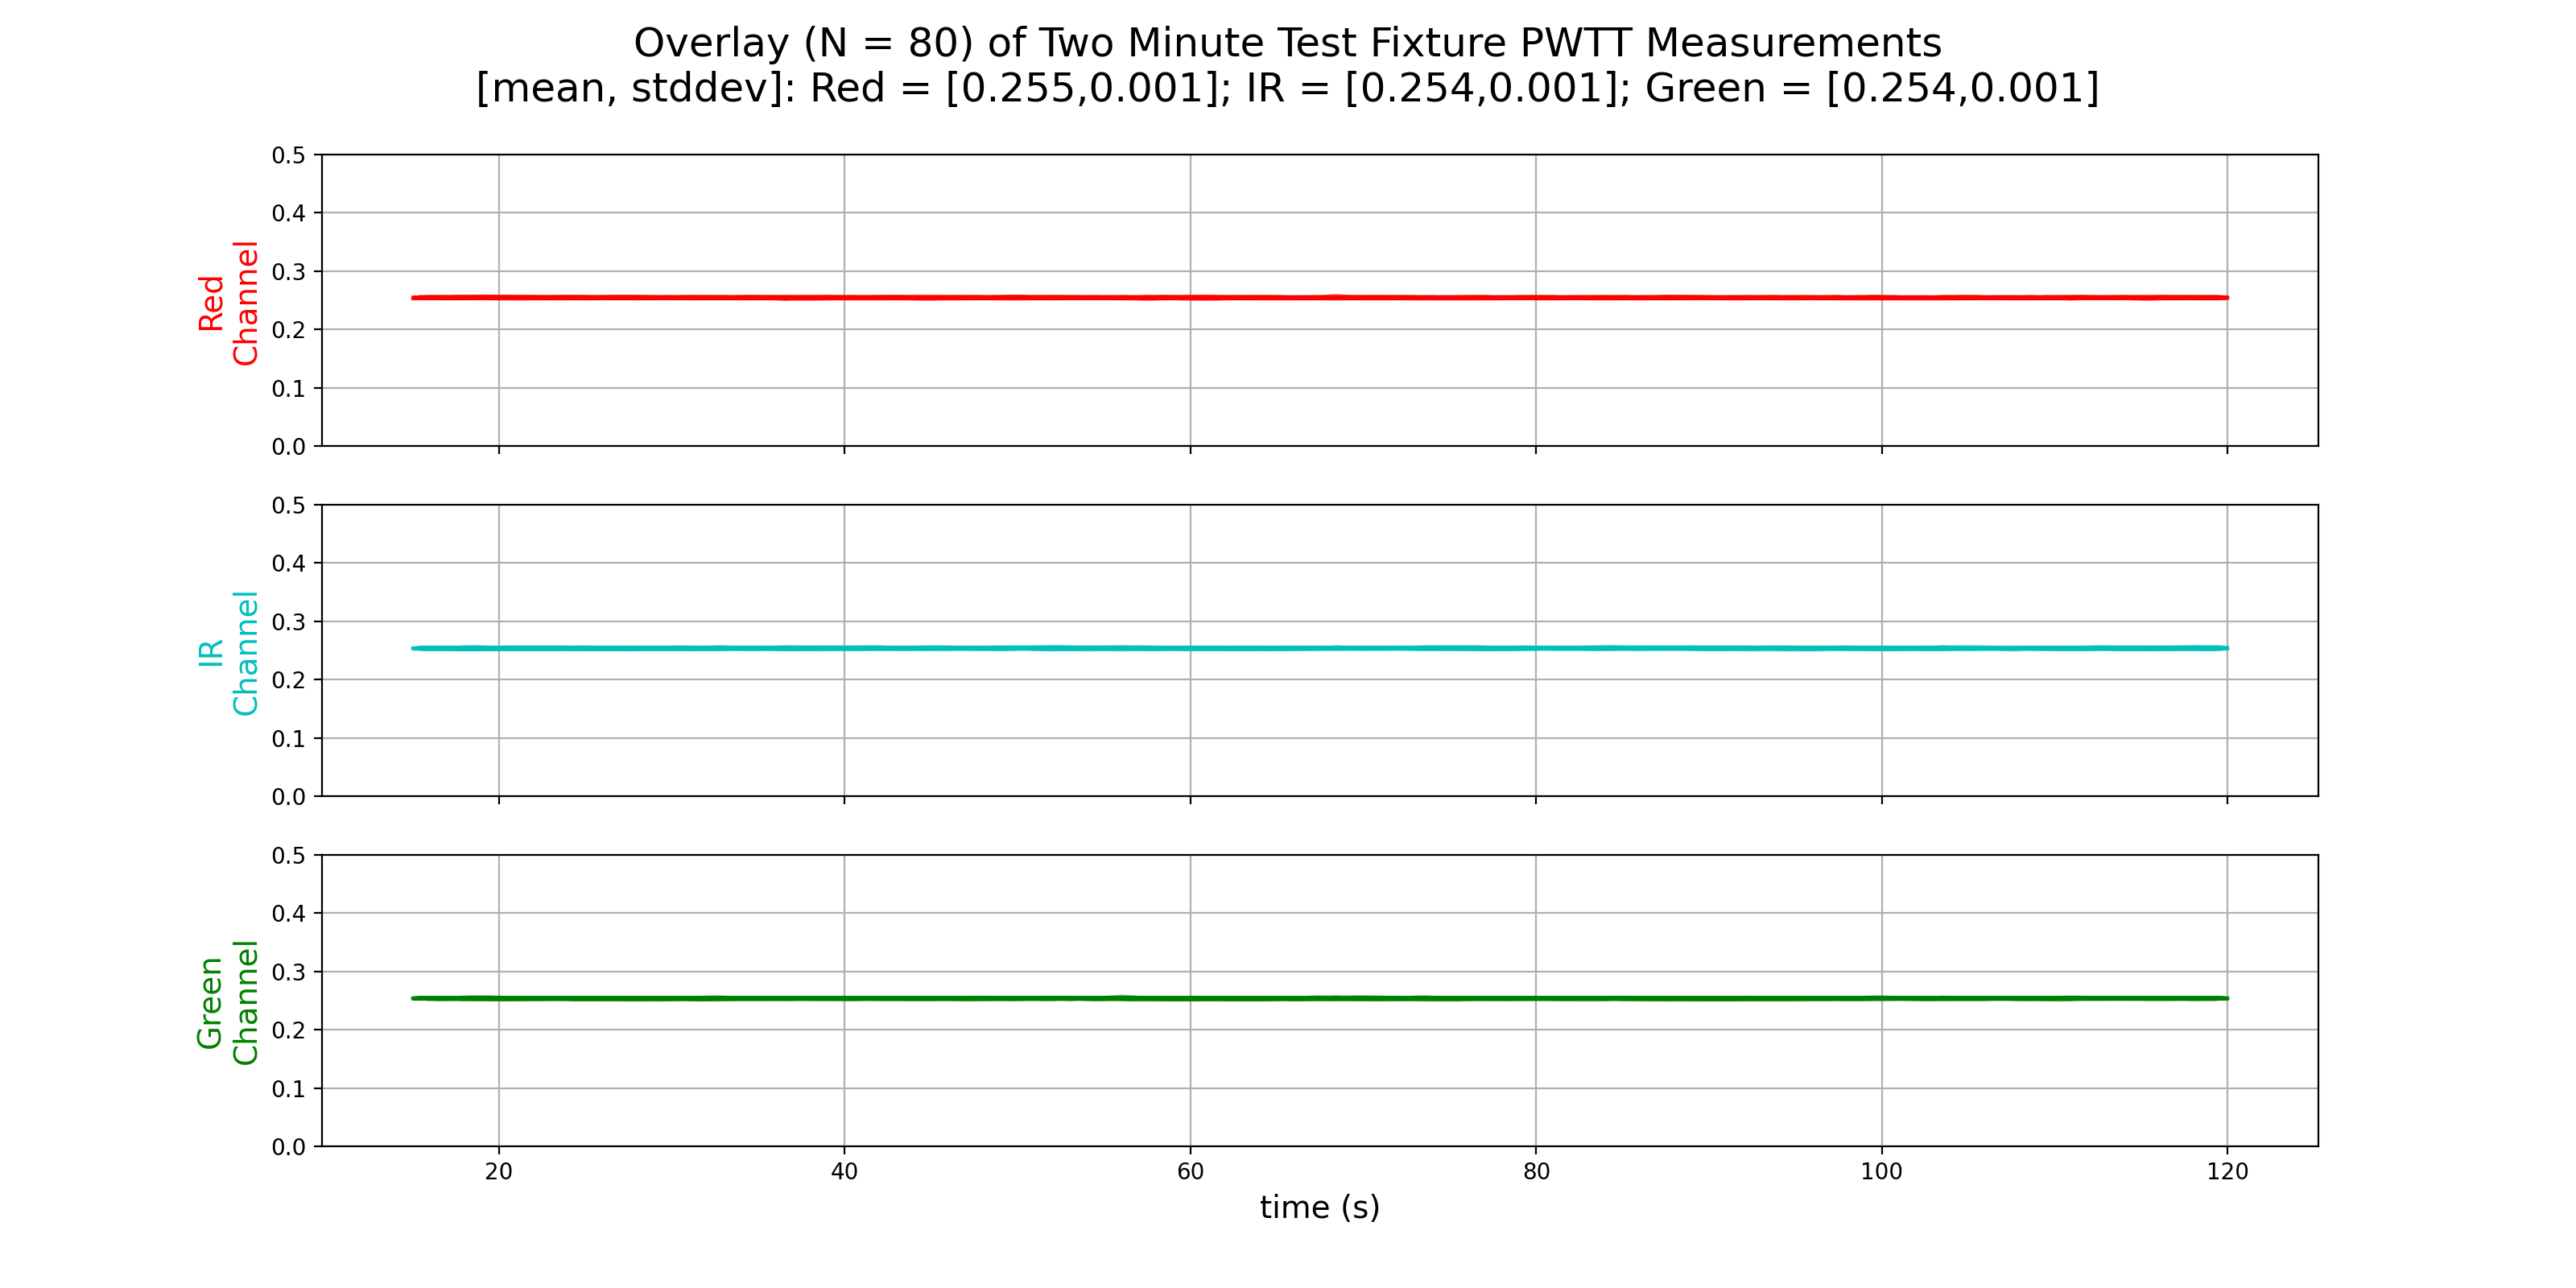
If the system is performing well then measurements of the test fixture's PWTT must be relatively constant even with noisy signals. Similarly, variation from run to run must be minimal. Having the test fixture in place allows us to run numerous repeats and long overnight sessions to assess overall stability and performance. For example, the following figure shows an overlay of the traces from 80 trials each 2 minutes long. The heart rate is set for 60 bpm so there are 120 pulses in each run and roughly the same number of reported PWTT values for each of the three PPG channels (minus some startup delay).
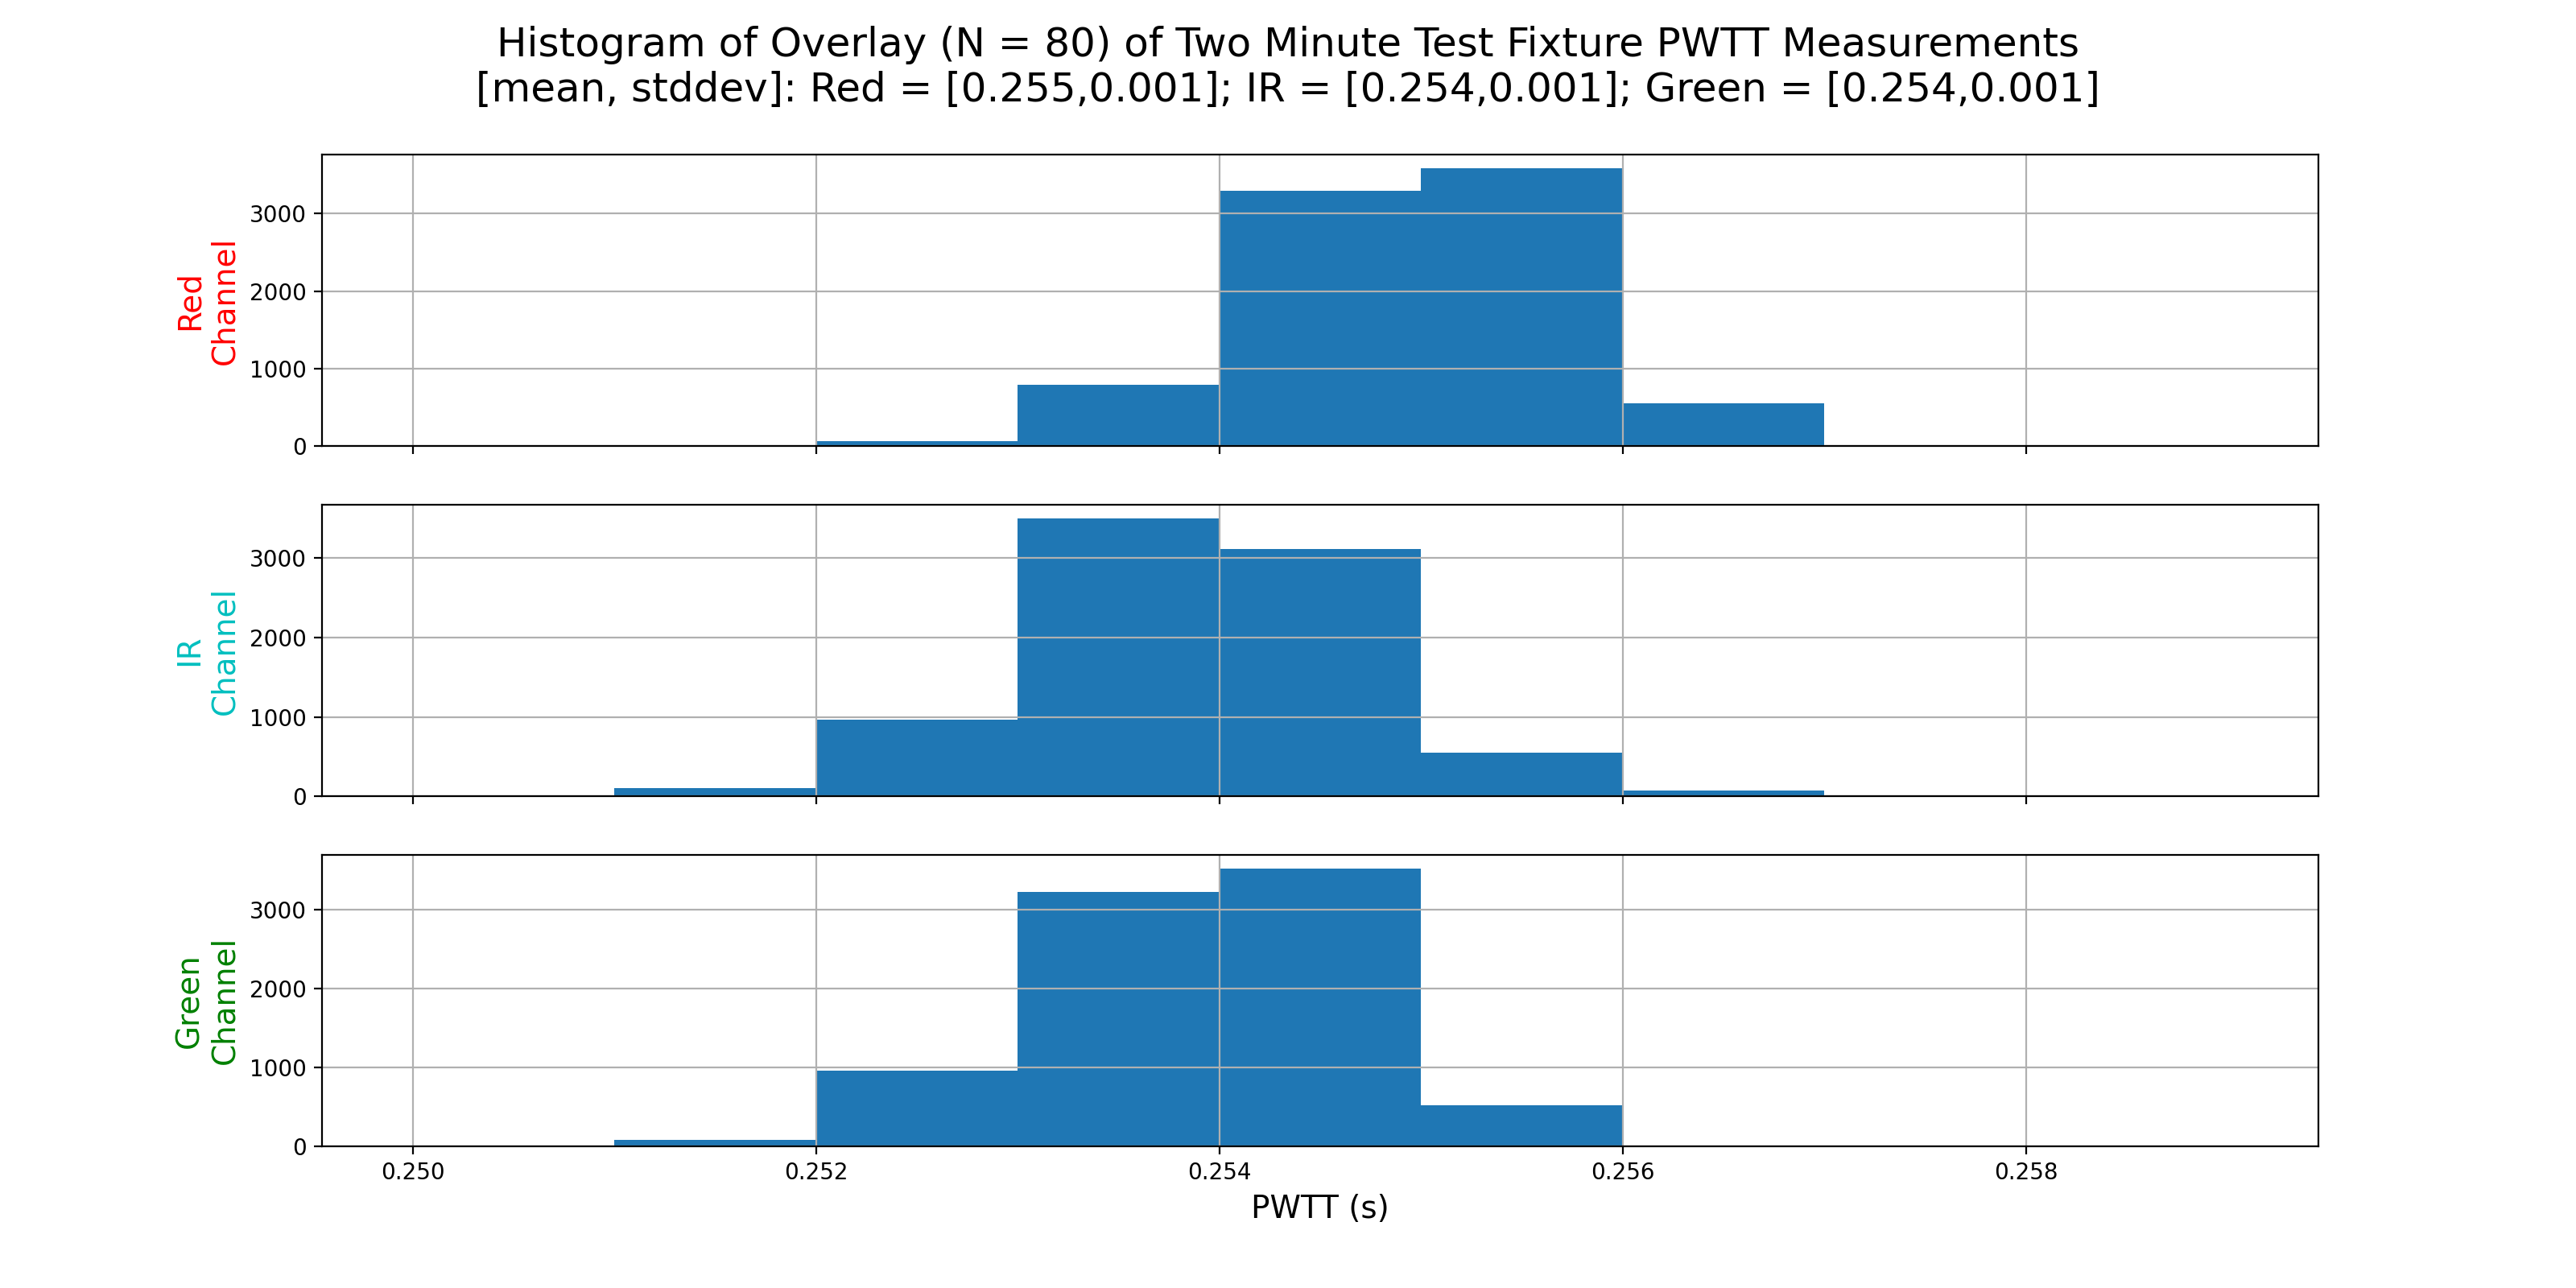
A histogram of all of the measured PWTT values in aggregate shows the accuracy of the measurement at +/- 3ms.
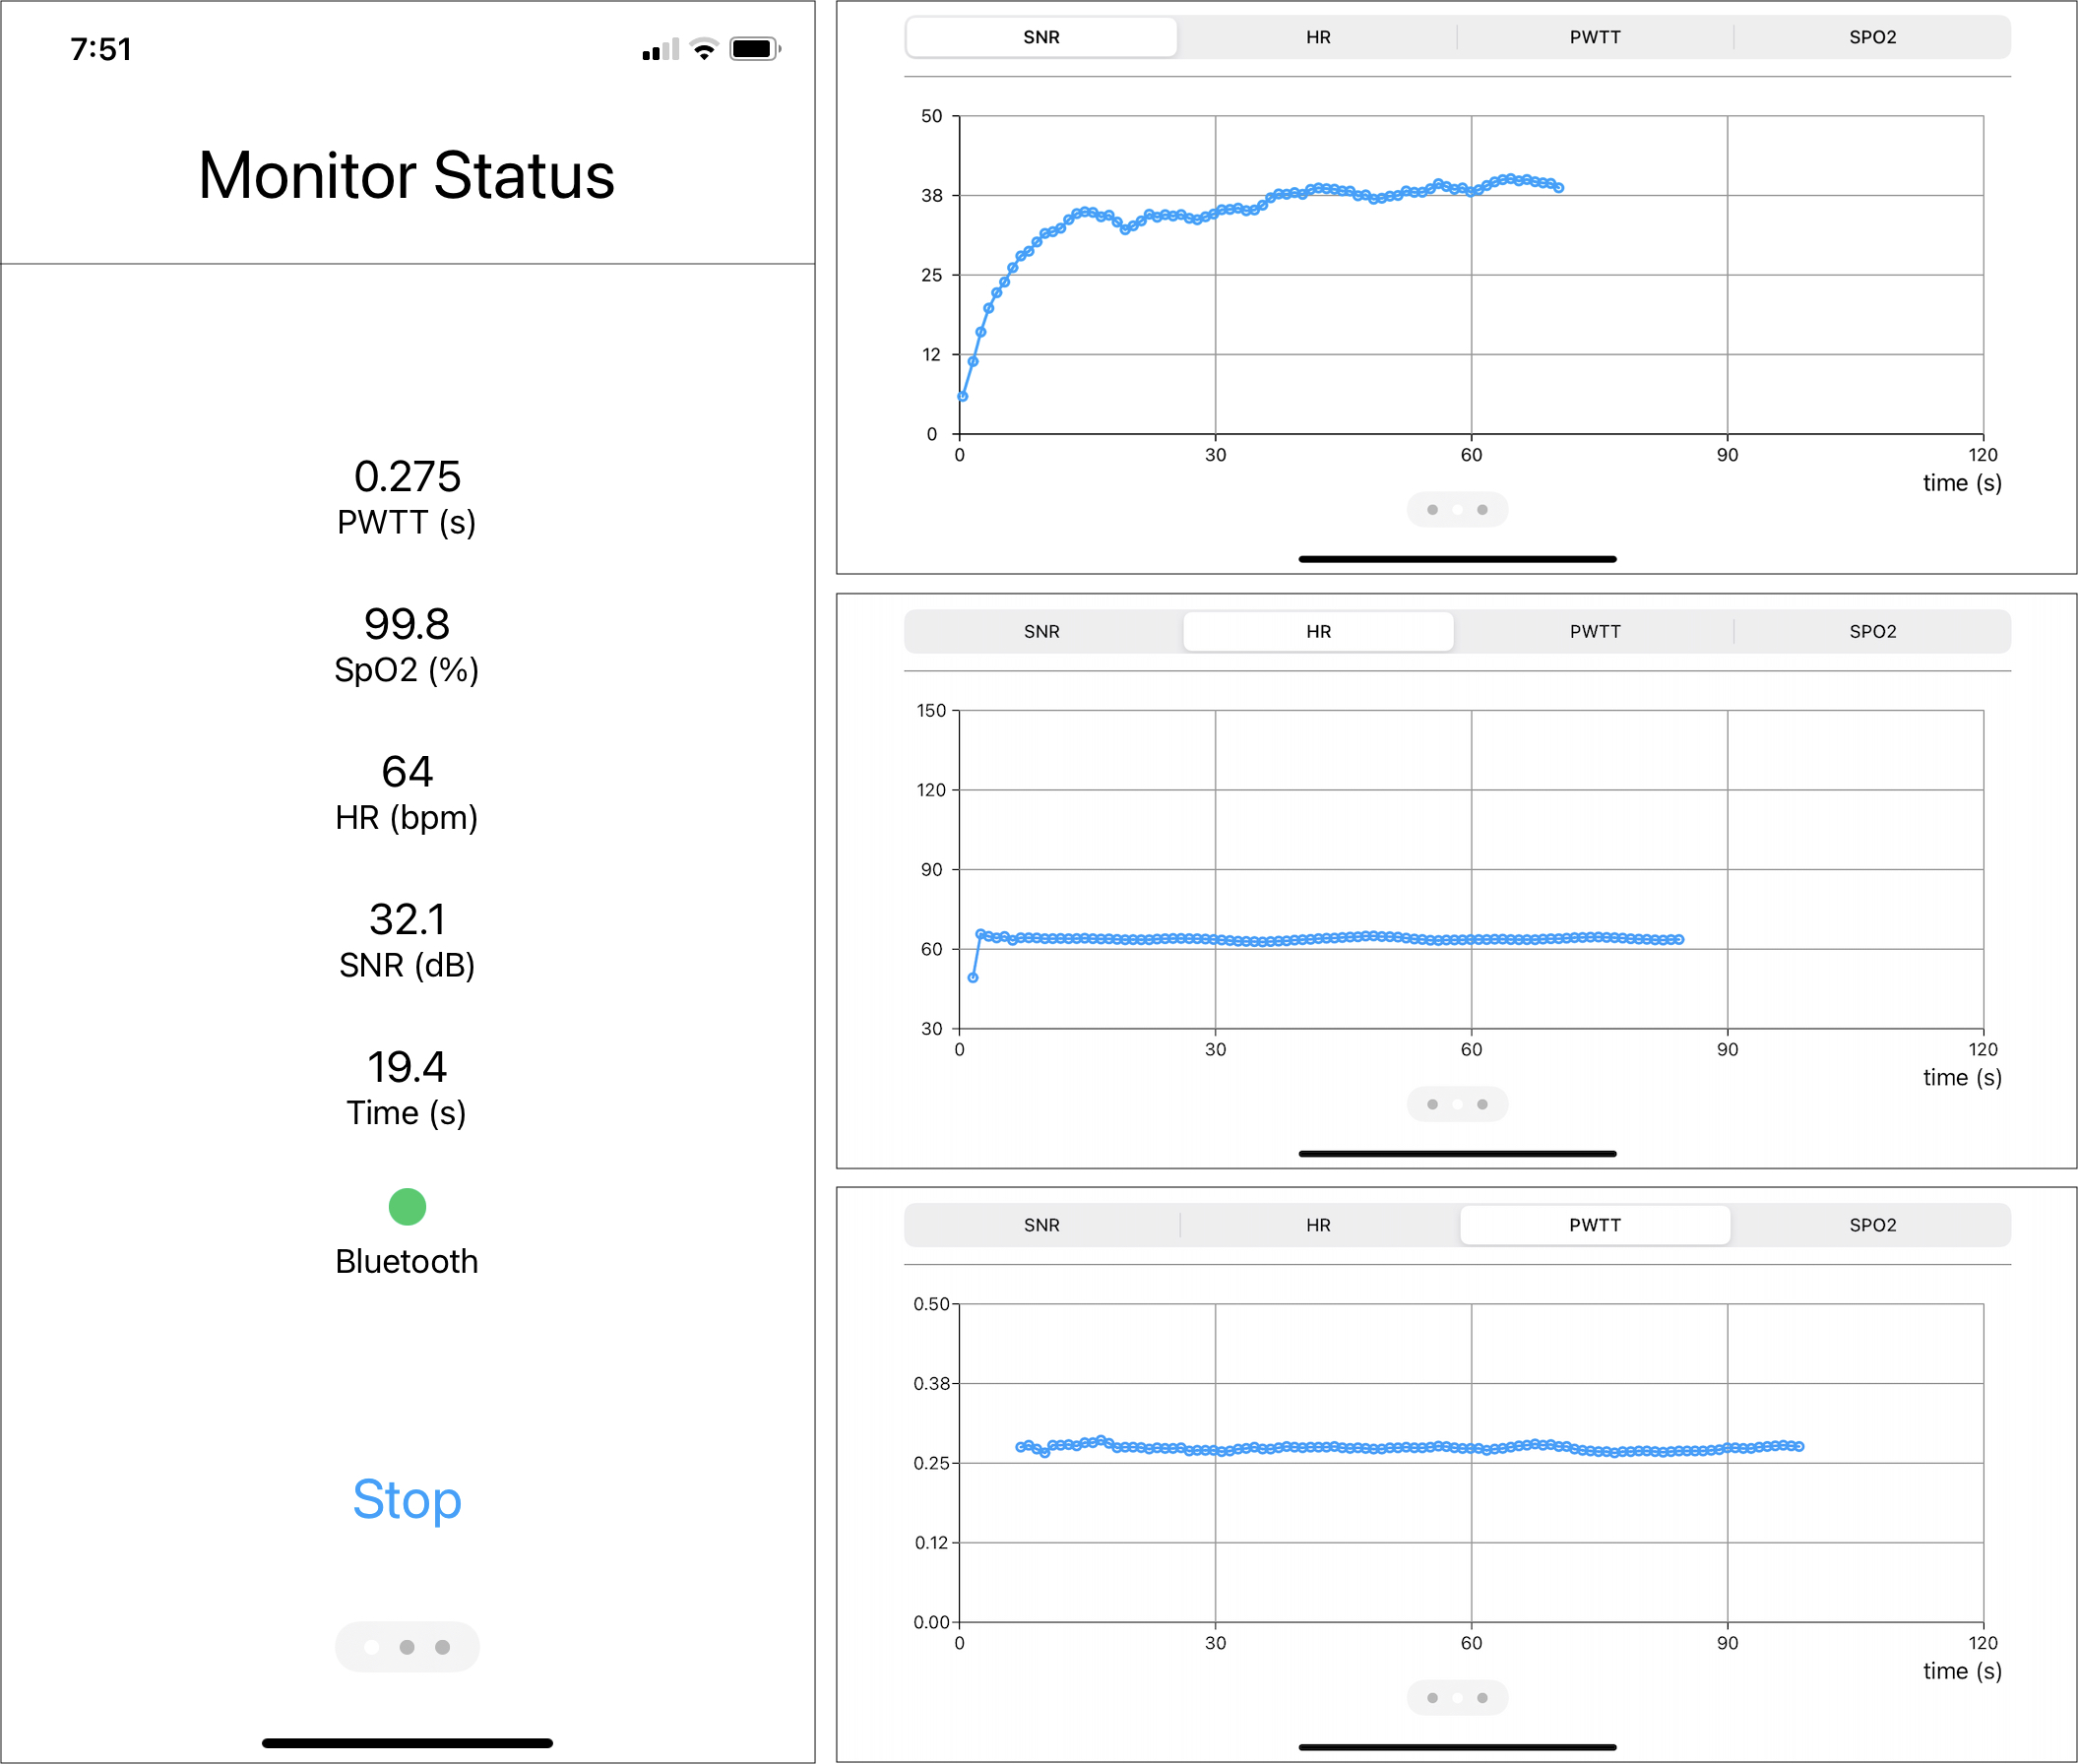
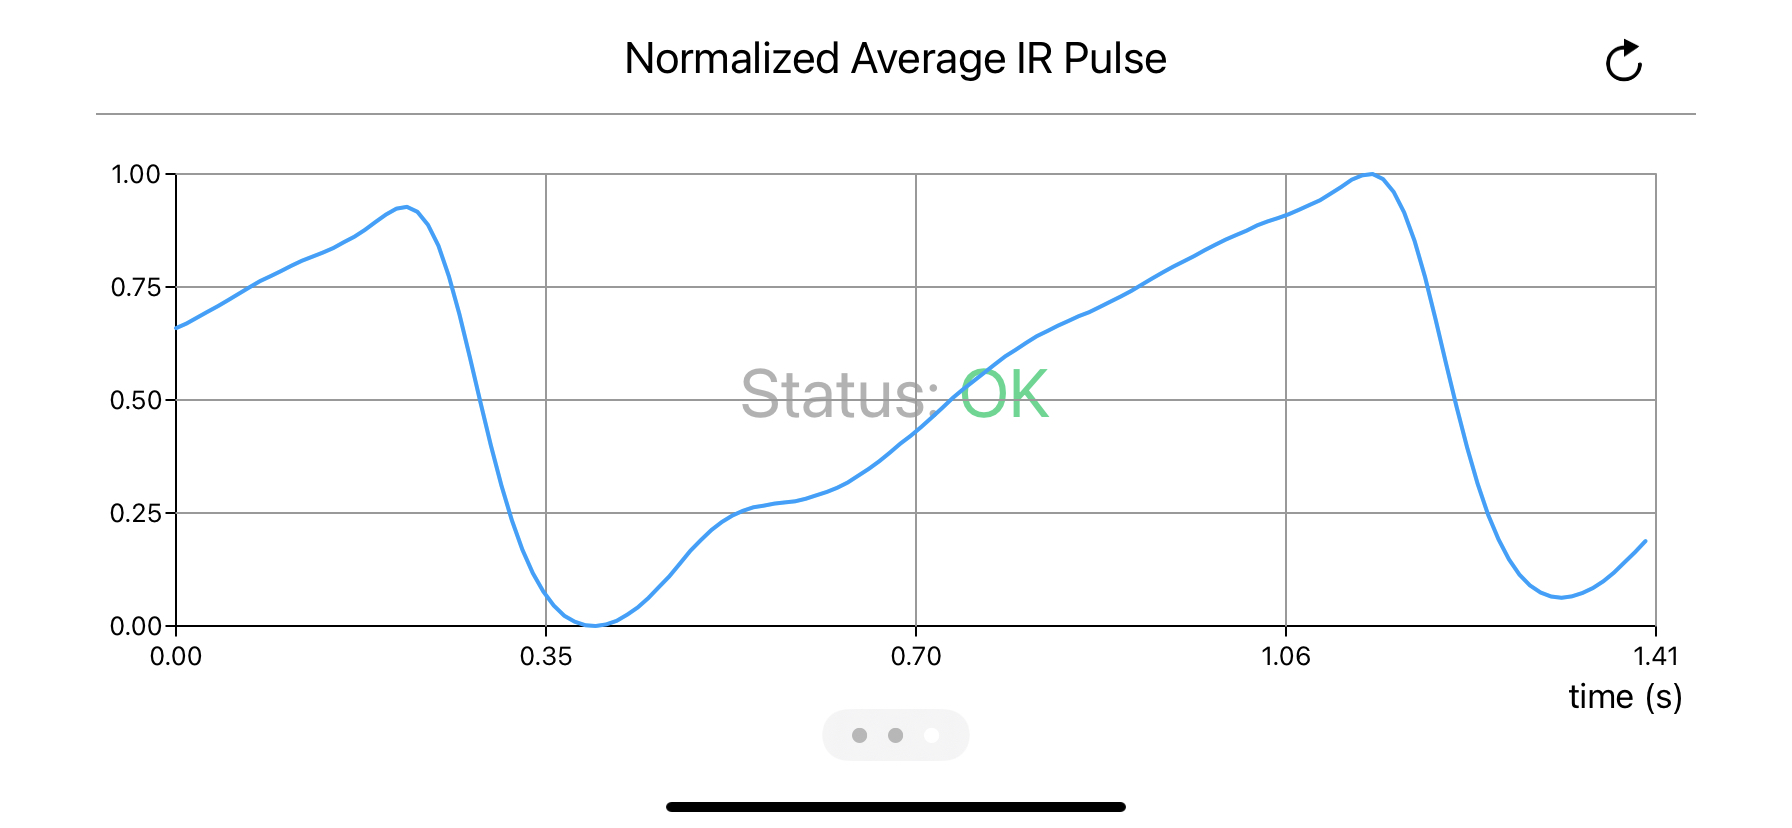
The mobile app presents device status, plots various metrics over time and forwards pulse data to the cloud. The cloud backend stores the pulse data and computes cardiac status, returning the result with minimal latency to the mobile app. The following screenshots depict a real-time session with a live subject.